You can learn to spot suspicious order book behaviour by eye, but it takes deliberate practice. This article gives you a routine you can run in NinjaTrader 8 Market Replay on ES or NQ, then shows how the same observations are turned into rules by an automated scanner.
Set up a practice session
Live markets move too fast to learn this. Replay lets you slow down and repeat.
- Download Market Replay data for ES or NQ (Tools > Historical Data > Load > Market Replay). Replay data includes market depth.
- Open a SuperDOM and check that it shows several levels on each side. If it only shows the best bid and ask, you have no depth to study.
- Pick a quiet stretch first, such as late morning, then a busy one like the first 30 minutes after the 08:30 Chicago open.
- Play at 1x or slower and pause whenever something stands out.
Five things to watch
1. Size that stands out from its neighbours
Ignore absolute numbers at first. Look for a level that is clearly bigger than the levels around it, roughly two to three times the typical size nearby. That is your candidate wall.
2. Where it sits
Walls right at the best bid or ask are constantly hit and refilled. Walls two to four levels away are easier to follow and are where misleading size often appears.
3. What happens as price comes closer
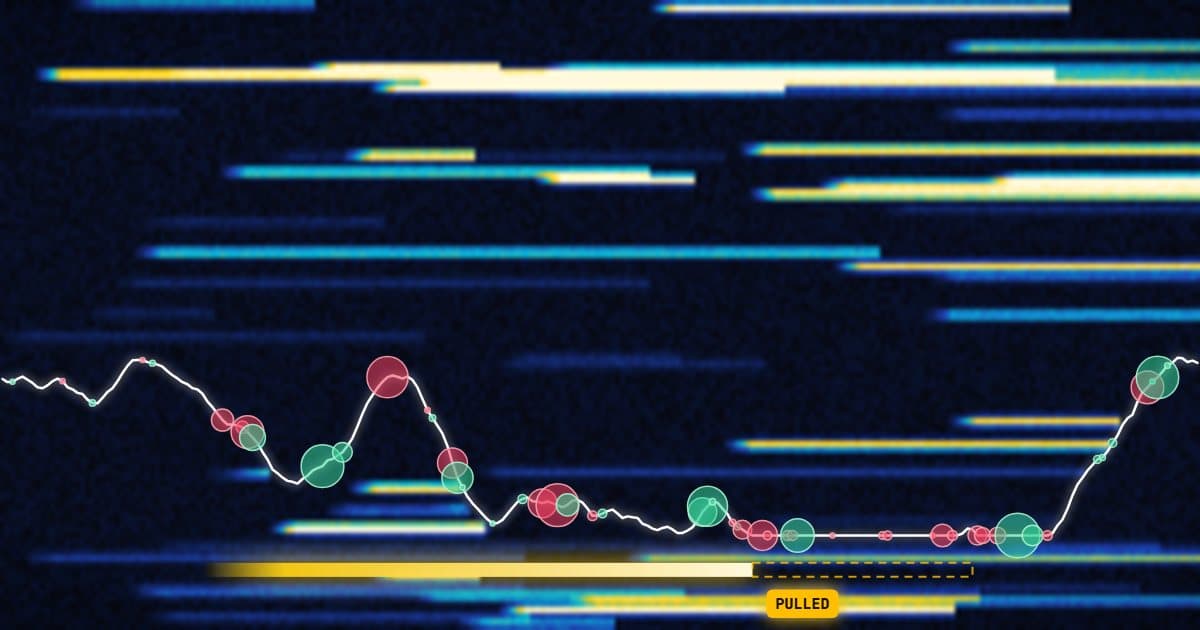
This is the key moment. A real resting order is usually still there when price arrives, and some of it trades. A suspicious wall shrinks or vanishes as price gets within a tick or two.
4. How long it lived and how it changed
Note roughly when it appeared. Walls that come and go within a few seconds, or whose size keeps jumping up and down, deserve more suspicion than one that sat calmly for minutes.
5. What traded on the other side
Watch Time & Sales. Was there aggressive buying while a big ask wall stood, or selling while a bid wall stood? Size shown on one side while the real business happens on the other is a classic pattern.
Keep a simple log
For every wall you notice, write down five things: side, distance from the touch, roughly how long it lasted, whether price approached it, and the outcome (traded, pulled, or still there). After a few sessions you will see your own data. Many walls are pulled for ordinary reasons and nothing follows. Some pulls are followed by a quick move the other way. Your log, not anyone's promise, tells you how often that happens.
How a scanner turns this into rules
Everything above maps closely to the Pulled Wall scanner used by Vantedge BookScope and BookPilot:
- Stands out from its neighbours becomes Pulled Wall Ratio: at least 2.2 times the average of the levels behind it by default.
- Where it sits becomes the scan band: Start Depth 2 and Pulled Wall Depth 4, which means the 3rd and 4th levels with the default settings.
- Vanishes without trading becomes Pull Fraction: 60% of the wall's peak size has to disappear without trading.
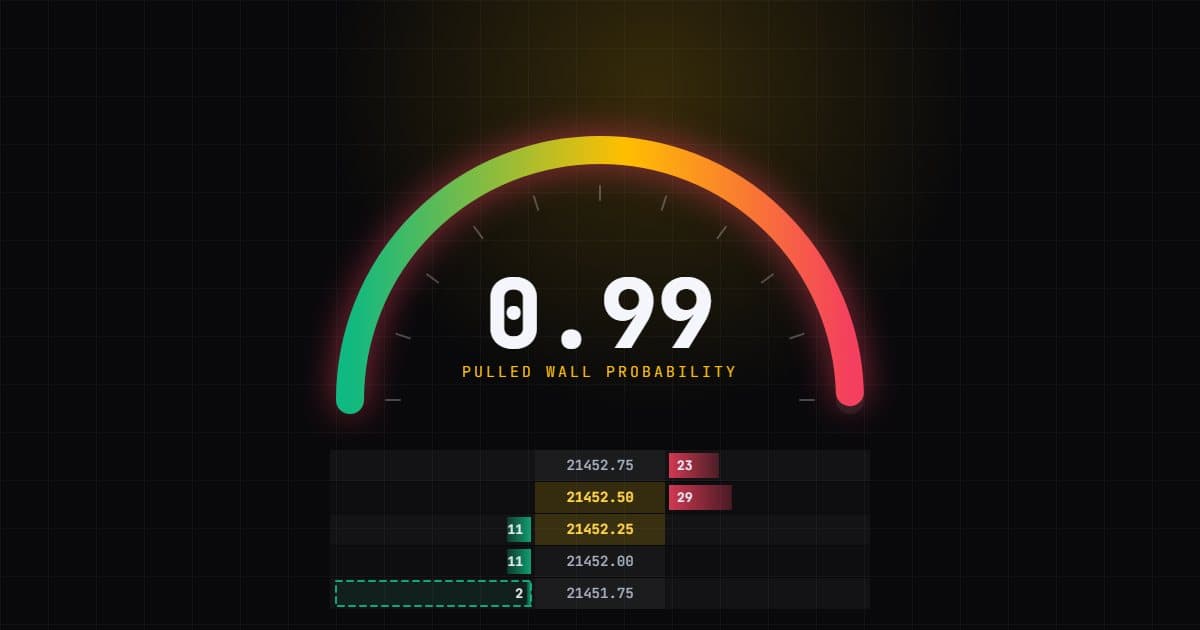
- Approach, short life, size changes, opposite aggression become the parts of a spoof probability between 0.0 and 1.0: a 0.35 base, +0.20 for an approached wall, and +0.15 for each of the other three.
Above Fire Probability (default 0.6), BookPilot fades the pulled wall: a pulled bid wall is a short signal and a pulled ask wall is a long one. BookScope draws the tracked walls as boxes with pull marks and flashes its on-chart DOM ladder when a signal fires. The BookPilot user guide explains each setting and its range.
Why manual practice still matters
Even if you plan to automate, watching walls by hand teaches you what the scanner's numbers mean. When you later see BookPilot's Blocked line refuse a signal, or a fade get stopped out, you will understand the book behind it. That makes tuning Pull Fraction or Fire Probability far less of a guessing game.
It also keeps expectations honest. You will see many pulls that lead nowhere. Detection only tells you something changed in the book. It does not tell you the next move.
A note on language
Spoofing is a legal term for orders placed with the intent to cancel them before they trade. You cannot see intent from a ladder. Call what you find "pulled walls" or "possible spoofing", and do not treat your observations as proof about any participant.
When you are ready to automate the routine, the BookPilot product page shows what the plan includes, and the comparison page covers whether a footprint strategy might suit you better.
Spotting pulled walls is a skill, not a safety net, and futures losses can add up quickly. Practise in Market Replay, trade the strategy on SIM, and only then consider an evaluation, funded or live account.