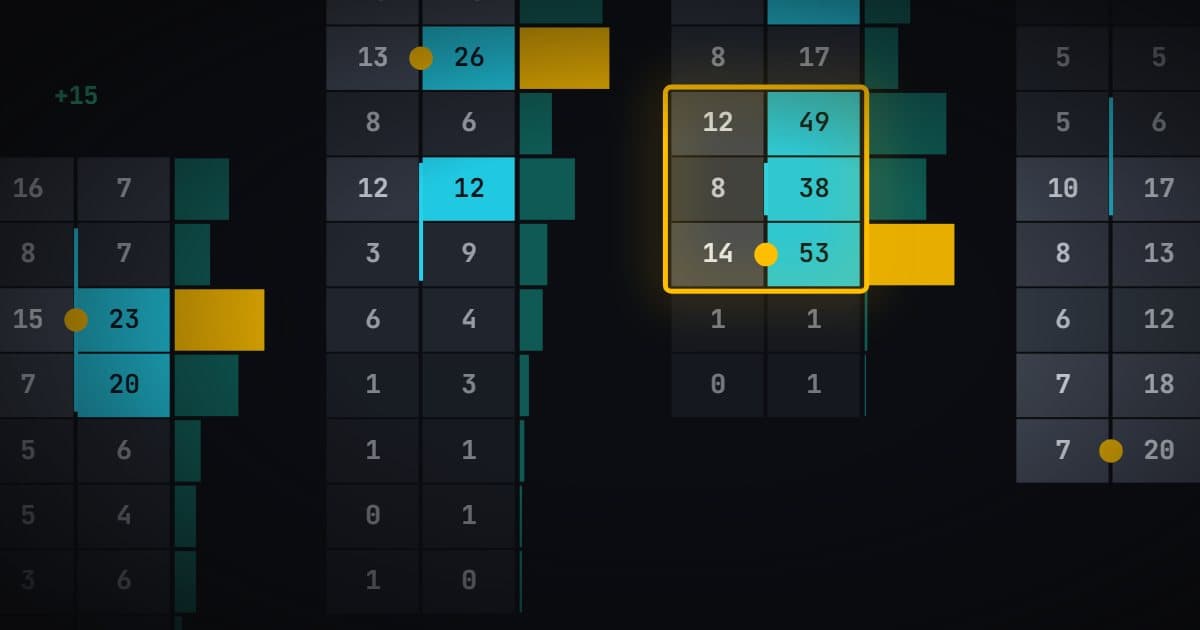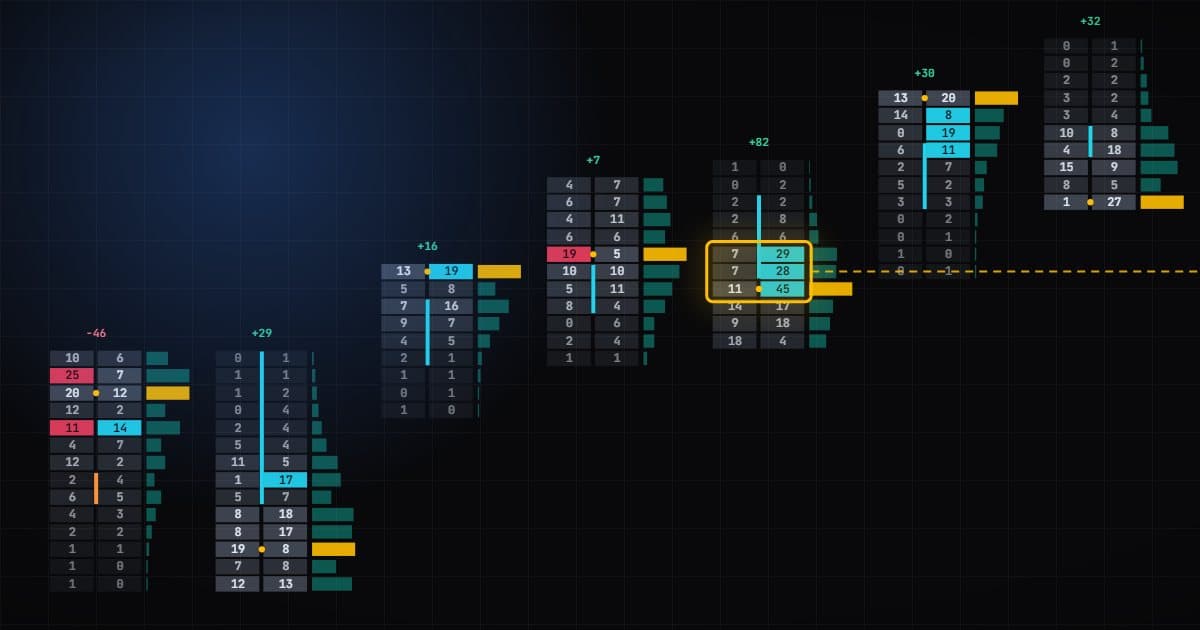
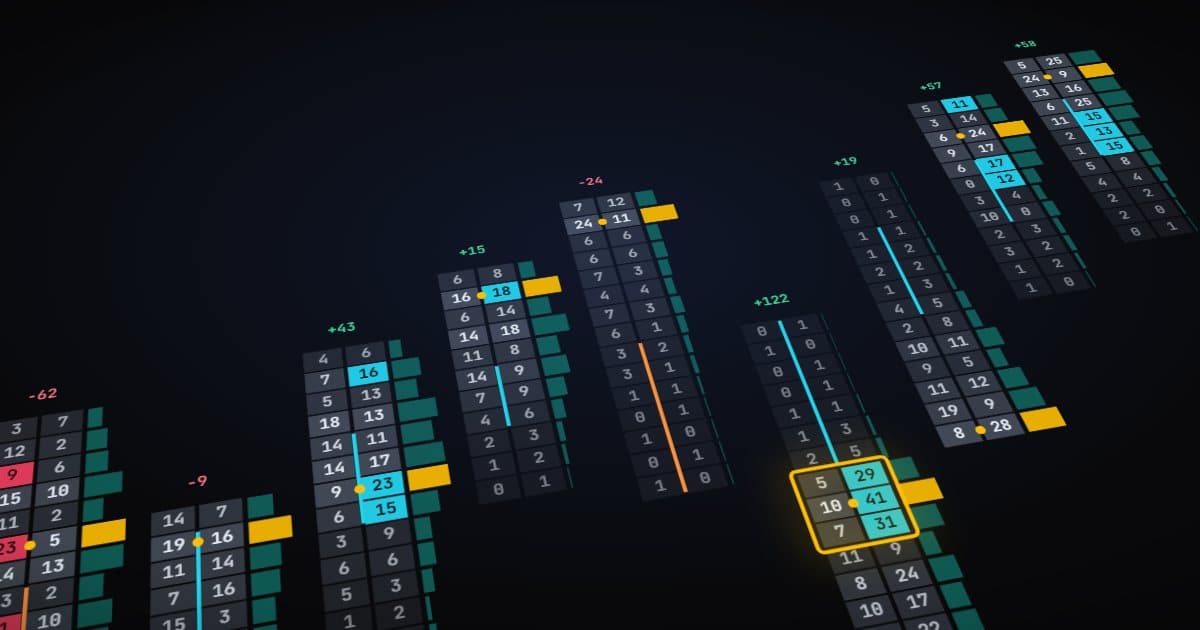
A footprint chart opens up each candle and shows how much traded at every price, split into selling at the bid and buying at the ask. Learning to trade it starts with reading a single bar properly. This walkthrough builds one bar from the ground up, then turns what you see into trade ideas.
Step 1: read the cells
Each price inside a footprint bar has two numbers. The left one is volume that traded at the bid, meaning sellers were aggressive and hit it. The right one is volume at the ask, where buyers lifted the offer. Take this illustrative ES bar, top to bottom:
| Price | Bid (sold) | Ask (bought) |
|---|---|---|
| 5001.00 | 14 | 96 |
| 5000.75 | 22 | 140 |
| 5000.50 | 31 | 118 |
| 5000.25 | 35 | 52 |
| 5000.00 | 40 | 18 |
The numbers are made up for the example. What matters is the reading method.
Step 2: compare diagonally
A buyer lifting the ask at one price is matched against the seller hitting the bid one tick lower, because those are the two prices that were quoted at the same moment. So compare each ask cell with the bid cell one row down.
- 5001.00: 96 bought vs 22 sold below. About 4.4 to 1.
- 5000.75: 140 vs 31. About 4.5 to 1.
- 5000.50: 118 vs 35. About 3.4 to 1.
- 5000.25: 52 vs 40. Not one-sided.
Step 3: mark imbalances
An imbalance is a level where one side is at least a set ratio of the other. A 300% ratio (3 to 1) is a common starting point. A minimum size on the stronger side keeps tiny numbers from qualifying. At 3 to 1, the top three levels of our bar are buying imbalances.
Step 4: look for a stack
Three buying imbalances on consecutive prices form a stacked imbalance. It means buyers pushed through several prices in a row, not just one. A stack on the ask side is bullish, a stack on the bid side bearish. A bar with both kinds at once is mixed and harder to read.
Step 5: check delta and absorption
Delta is buying minus selling for the whole bar. Here it is 424 bought minus 142 sold, strongly positive, so it agrees with the stack. If a bar shows a bullish stack but price closes near its low, aggressive buyers were probably being absorbed by passive sellers. That is a warning, not a confirmation.
Two ways to trade what you see
Follow the stack
When aggression moves price, a stack often marks the start of a push. Traders who follow buy a bullish stack, with a stop beyond the stack and a target sized to the market.
Fade the stack
When the market is rotating and aggression keeps getting absorbed, a stack can mark exhaustion. Traders who fade sell a bullish stack, expecting price to snap back.
The hard part is not spotting stacks. It is knowing which of the two the market is rewarding today, and following the same rules every time.
Where automation comes in
Vantedge FlowPilot automates this exact reading on NinjaTrader 8. It checks the forming bar on every trade, flags a level when one side is at least 3 times the other diagonally with at least 10 contracts on the stronger side, and triggers on 3 stacked levels by default. A congruent-delta filter, on by default, requires the bar's delta to agree with the stack, and a bar with both a bullish and a bearish stack is skipped.
The follow-or-fade choice is handled by its mode: Follow, Fade, or Auto. Auto picks the Trend regime (follow) or the Regression regime (fade) from how closely price change has tracked delta over the last few bars. The included Vantedge Footprint indicator shows the same imbalances on your chart so you can see what the strategy is reacting to. The FlowPilot guide covers every setting, and the glossary defines the terms used above.
Practise before you trade it
Footprint history needs Tick Replay turned on in NinjaTrader, or the bars have no bid and ask detail. Replay a few sessions and mark every stack you see by hand. Note whether following or fading would have worked. That exercise teaches more than any rule of thumb.
Reading footprint bars well still leaves you exposed to sizeable futures losses. Practise in SIM and replay first, and only then consider an evaluation, funded or live account.