
Order-flow analytics software is only as useful as the numbers it computes and your understanding of them. Rather than compare products, this article explains the metrics themselves: what each one measures, what it is good for, and where it misleads. Along the way you will see which of them the Vantedge strategies actually use.
Metrics built from trades
These come from the trade tape: every executed trade, tagged by whether it hit the bid or the ask. Tick data with bid/ask is enough to compute them.
Delta
Buy volume at the ask minus sell volume at the bid, usually per bar. Positive delta means buyers were more aggressive in that bar. It says nothing about who was passive on the other side, which is why delta and price sometimes disagree.
Cumulative delta
Delta added up across the session. Its slope tells you who has been more aggressive over time. A divergence, where price makes a new high but cumulative delta does not, is a common warning sign that the move is running on less aggression.
Bid/ask imbalance
At a single price in the footprint, one side's volume compared with the other's. Most tools compare diagonally: buying at a price against selling one tick lower. A ratio of 3:1 or 300% is a common threshold.
Stacked imbalance
Several imbalances on consecutive prices, on the same side. It suggests one side pushed through several levels in a row rather than at one price. This is the trigger Vantedge FlowPilot trades: 3 stacked at 300% by default, with at least 10 contracts on the stronger side of each level.
Absorption
Heavy volume at a price that fails to move the market further. It points to passive orders soaking up aggression. Vantedge Footprint marks absorption on the chart; FlowPilot's congruent-delta filter is a related idea, skipping stacks whose bar delta disagrees.
Metrics built from the order book
These need a Level 2 depth feed, because they read resting orders that have not traded.
Depth ratio
Total size on the bid divided by total size on the ask over a set number of levels. BookPilot's Pressure Break uses the first 2 levels by default and needs a 4x ratio held at 2.5x or more for 250 ms. The Vantedge DOM Pressure Matrix shows depth ratios at L3, L5 and L10 in a SuperDOM column.
Queue imbalance
The same comparison at the best bid and ask only. It reacts fastest and is noisiest.
Microprice
A version of the mid price weighted by the size at the touch. When the bid queue is much bigger than the ask queue, the microprice sits closer to the ask, hinting at which side is likelier to give way first.
Spoof probability
A score for a large resting order that is pulled without trading. In BookScope and BookPilot it runs from 0.0 to 1.0, built from a base value plus fixed amounts for price approaching the wall, a short life, frequent size changes and opposite aggressive volume.
Metrics that combine both
Short-horizon forecast
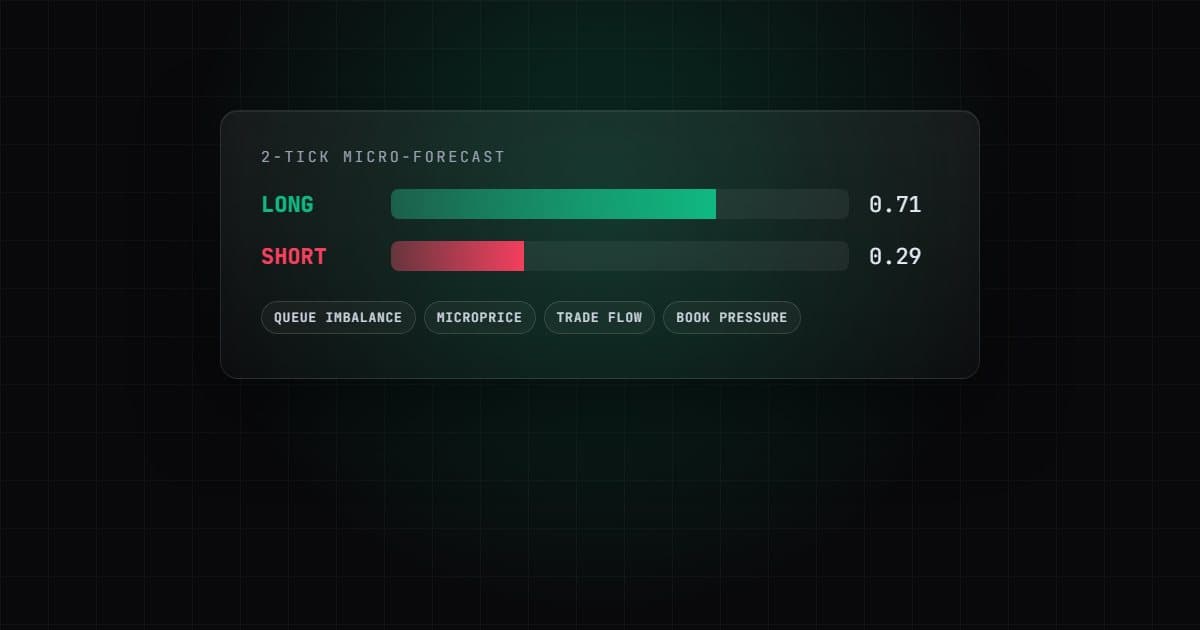
BookPilot's Micro-Forecast is a logistic model of the next 2-tick move of the mid price. It takes queue imbalance, microprice offset, the buy/sell balance of the last 50 trades and the Pressure Break ratio, and outputs a probability of an up move. That becomes a Long, Short or None bias, and with Forecast Confirm on, a signal must agree with it before it is traded.
Delta-price correlation
How closely price change has tracked delta over recent bars. FlowPilot uses it in Auto mode to choose between following stacks (Trend) and fading them (Regression).
Where metrics mislead
- Thin levels. A 5:1 ratio between 5 contracts and 1 is noise. Always pair ratios with a minimum size.
- Bar size. Bigger bars collect more volume and produce more imbalances. Compare like with like.
- Displayed size only. Book metrics cannot see hidden orders, and resting size can vanish in milliseconds.
- Time of day. The same reading means different things at the open and at lunch.
Using this when choosing software
Ask which of these metrics a tool computes, with which defaults, and whether you can see them. If you want to compare a trade-based strategy with a book-based one, the comparison page lines up FlowPilot and BookPilot metric by metric, and the glossary defines the terms used here.
Understanding a metric does not make trading on it safe, and futures losses can exceed what you planned. Test any strategy built on these numbers on SIM, and in Market Replay for book-based ones, before an evaluation, funded or live account.