A sweep is an aggressive order big enough to take out several price levels at once. It leaves a clear trace in the data, and traders like to call it institutional. The trace is real. The label is usually a guess. Here is how to spot sweeps and what you can and cannot conclude from them.
What a sweep is
A market order, or a marketable limit order, fills against the best resting price first. If it is larger than the size there, it keeps filling at the next price, and the next, until it is complete. In a few milliseconds the order clears several levels of the book and price jumps.
Sweeps can come from a single large order or from many smaller ones arriving together, for example in reaction to news. In the data, both can look the same.
Signs of a sweep on the footprint
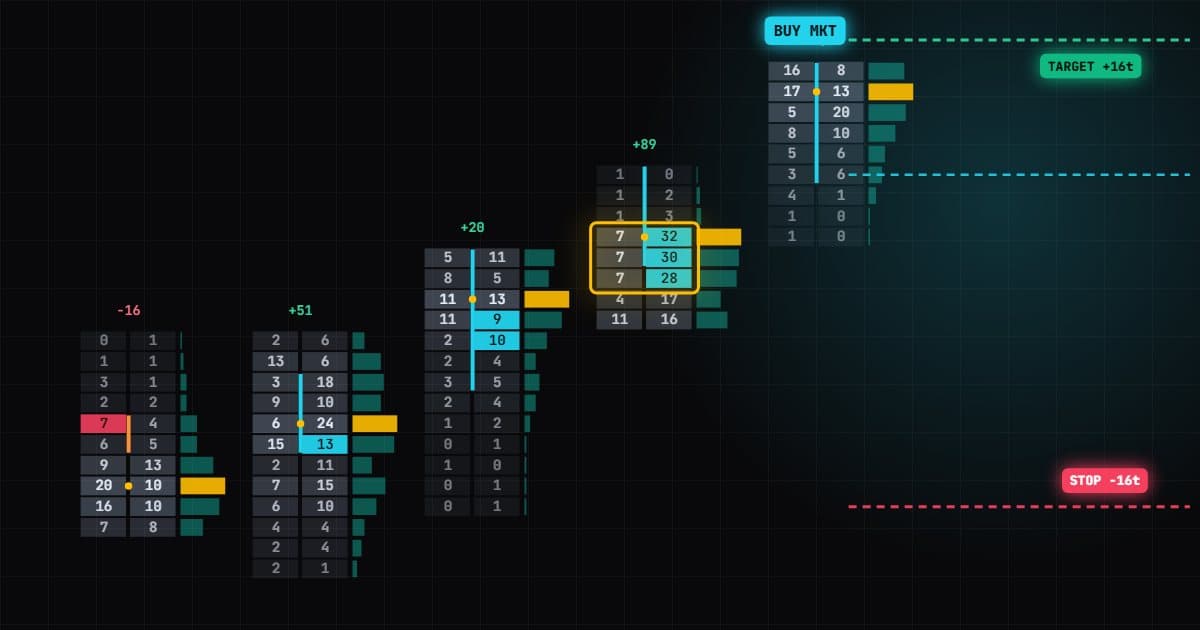
- Heavy one-sided volume across consecutive prices. A buy sweep shows large ask-side volume on several prices in a row inside one bar.
- Stacked imbalances. Comparing ask volume at each price with bid volume one tick lower, several levels in a row show a lopsided ratio. A sweep is one of the ways a stacked imbalance forms.
- A jump in delta. The bar's delta moves sharply in the sweep's direction.
- Thin volume on the way back. If price returns through the swept prices later with little trade, the sweep left a low-volume gap.
Signs in the order book
- Several levels empty at once. The best ask and the levels behind it disappear in one update, not one by one.
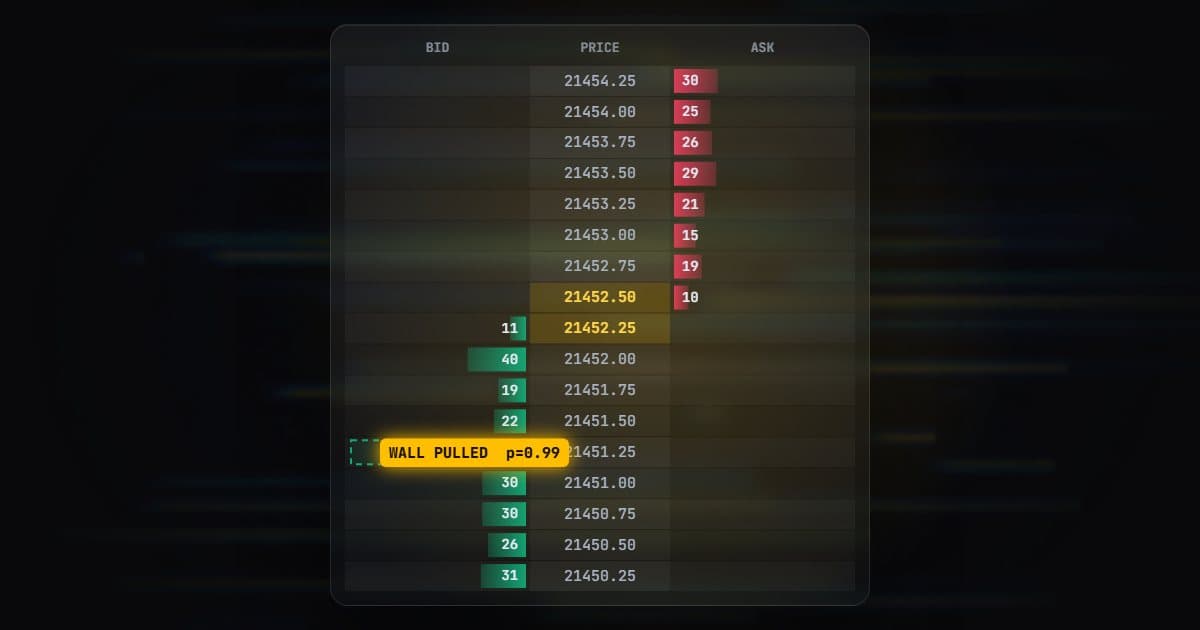
- Removed by trades, not cancels. This is the important distinction. Size that vanishes because it traded is a sweep. Size that vanishes with no trades at those prices was pulled.
- The book refilling. After the sweep, watch whether resting orders come back at the new prices or the book stays thin.
Why "institutional" is an assumption
Exchange data does not tell you who traded. A sweep could be a fund, a bank, a market maker covering risk, a cluster of stop orders triggering together, or many retail traders reacting to the same headline. Size suggests a large participant but does not prove it. Treat the sweep as an event, not as a message about who is behind it.
It is also worth separating cause and effect. Stop runs often look like sweeps because a row of stop orders becomes a row of market orders. Those sweeps can mark the end of a move rather than the start.
Trading around sweeps
Continuation
If price holds beyond the swept levels and delta keeps agreeing, the sweep may be the start of a push.
Exhaustion
If price stalls right after the sweep and the aggressive volume is absorbed, the sweep may have used up the remaining buyers or sellers, and price can snap back.
Which one plays out depends on the market's state at the time, which is exactly the hard part.
How this relates to FlowPilot and BookPilot
Neither Vantedge strategy has a sweep detector, and neither claims to identify institutions. Their signals do overlap with what sweeps leave behind:
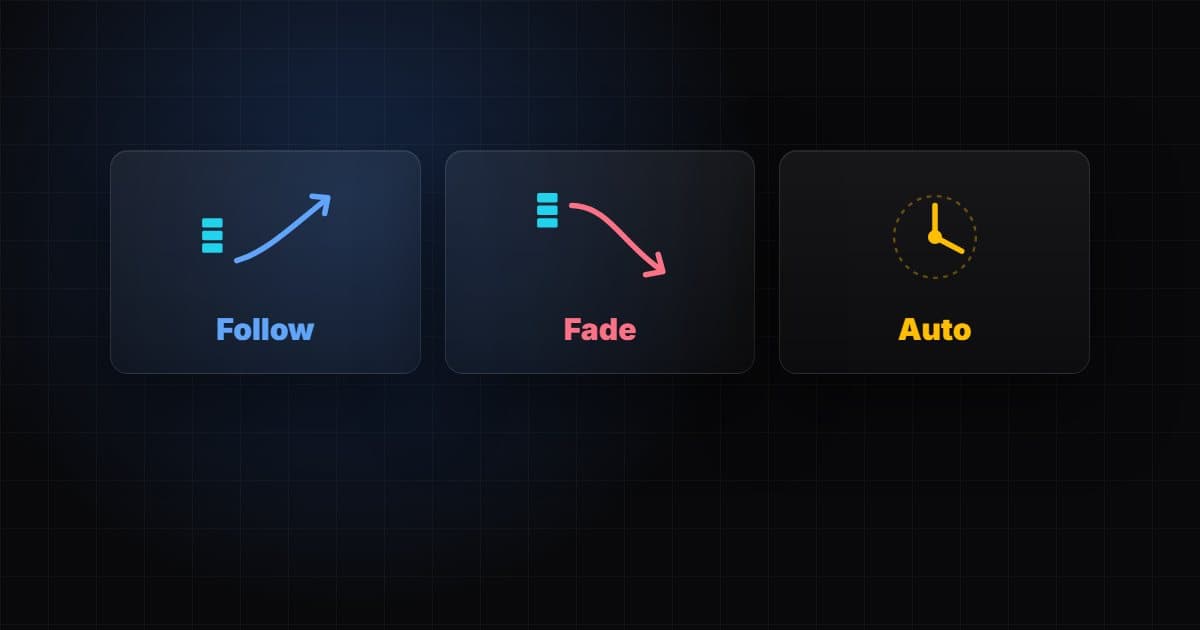
- FlowPilot triggers on 3 stacked bid/ask imbalances at 300% in the forming bar by default. A sweep can produce that stack, and so can steady aggression over a whole bar. FlowPilot's Auto mode chooses between following the stack (Trend regime) and fading it (Regression regime) from how closely price has been tracking delta, which mirrors the continuation-or-exhaustion question above.
- BookPilot's Pulled Wall signal is built on the trades-versus-cancels distinction. It only scores a wall when most of it is removed without trading. A wall that is swept, meaning it traded, is not a Pulled Wall signal.
The comparison page sets out which data each strategy reads, and the glossary defines sweeps, stacks and absorption.
Big orders do not make a trade any safer, and futures losses can come quickly. Study sweeps in replay and test any idea in SIM before risking an evaluation, funded or live account.