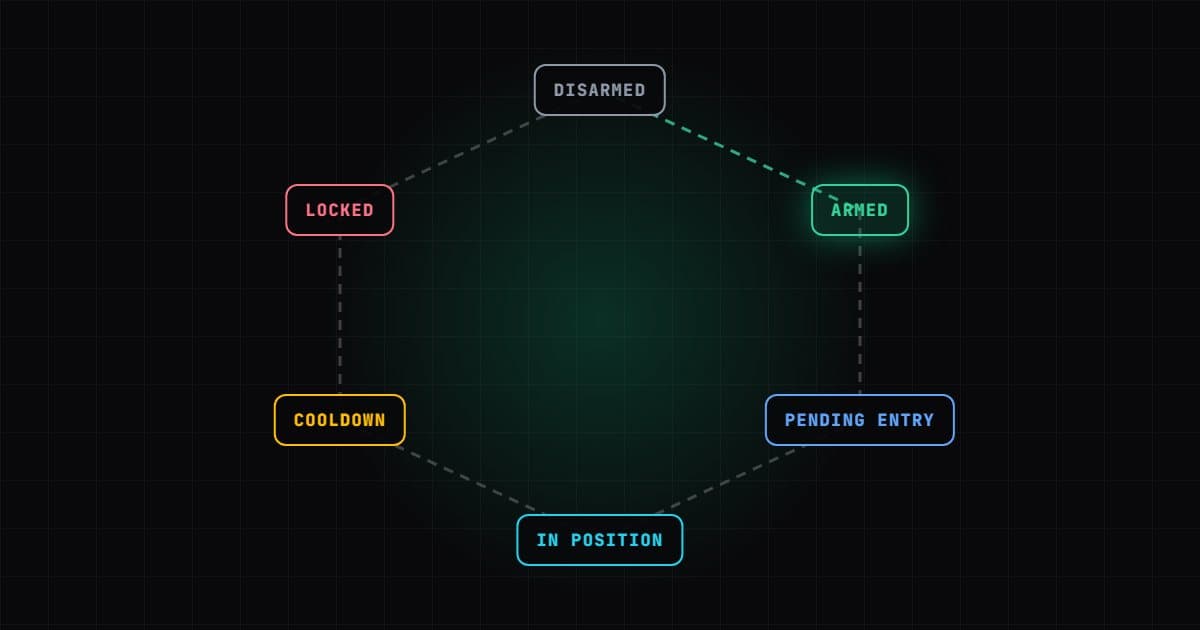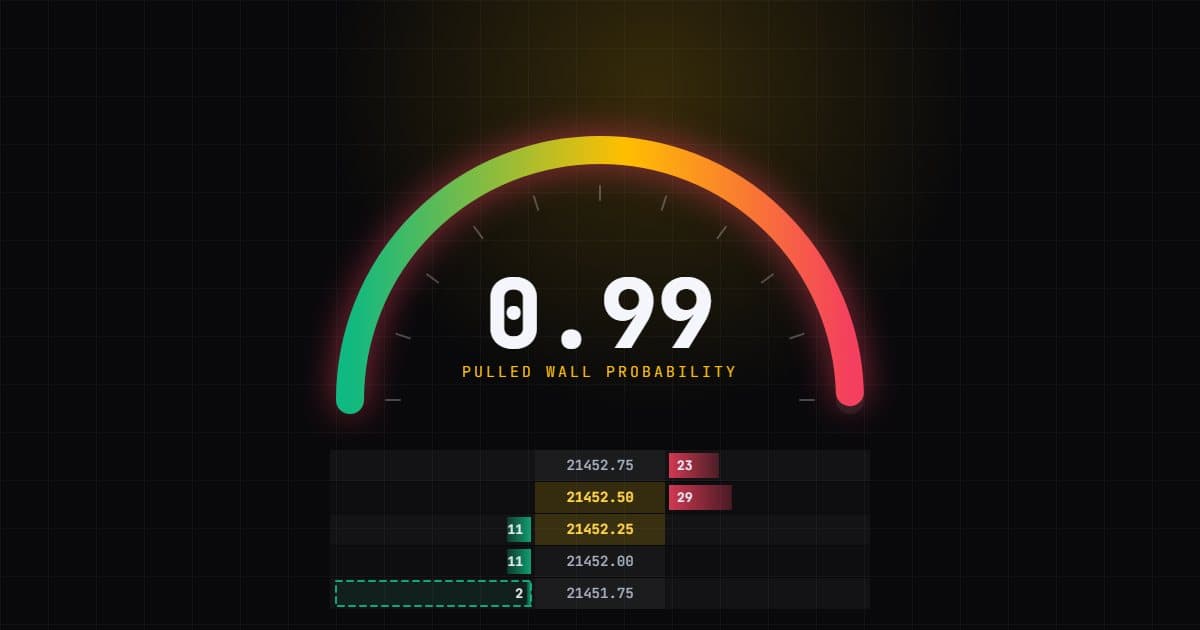

A depth ladder shows a snapshot. What usually matters is how the snapshot changes: which side is building, which side is being cancelled, which large orders are real. A useful analytics tool turns those changes into a handful of numbers you can actually watch.
Static depth vs depth dynamics
Static depth answers "how much is resting at each price right now". Dynamics answers "what is happening to it". Two books with identical snapshots can be very different: in one, the bid has been steady for a minute; in the other, it appeared half a second ago and is already shrinking. The measurements below each capture part of that difference.
Measurements worth having
Summed depth ratio
Total size on the first few levels of the bid, divided by the same on the ask. It smooths out single-level noise. Choosing how many levels to include is a trade-off: more levels is steadier, fewer is faster. BookPilot's Pressure Break uses the first 2 levels by default.
Queue imbalance at the touch
The best bid size against the best ask size. It is the most immediate measure of which queue is likely to be exhausted first, and therefore which way the next tick may go.
Microprice offset
The microprice weights the bid and ask prices by the size on the opposite side, so it sits closer to the side with less size behind it. Its distance from the plain mid price is a compact summary of touch imbalance.
Trade-flow balance
Not depth itself, but the context depth needs: the share of recent trades that were aggressive buys versus sells. Depth tells you who is waiting; trade flow tells you who is acting.
Wall lifecycle
For unusually large levels, the history matters more than the size: when the level appeared, whether price approached it, and whether it was filled, pulled or expired.
Multi-range ratios and thinning
Comparing depth ratios across several ranges, such as the first 3, 5 and 10 levels, shows whether an imbalance is local to the touch or runs deep. Sudden drains on one side flag a thinning book.
Where each one appears
| Measurement | Where it is used |
|---|---|
| Summed depth ratio | Pressure Break scanner (BookPilot, BookScope) |
| Queue imbalance, microprice offset, trade-flow balance | Inputs to the Micro-Forecast |
| Wall lifecycle | Pulled Wall scanner, drawn as wall boxes in BookScope |
| L3 / L5 / L10 ratios, stacked pressure, thinning | Vantedge DOM Pressure Matrix SuperDOM column |
The Micro-Forecast combines queue imbalance, microprice offset, the buy/sell balance of the last 50 prints and the Pressure Break ratio in a logistic model of the next 2-tick move. Its output, a probability called P up, sets the Long, Short or None bias that Vantedge BookPilot uses in its With Bias mode.
BookScope also draws Trend Vectors: the slope of the mid price over the last 5, 20, 40 and 150 price changes. They describe recent direction at several speeds, which helps put a book signal in context.
Pitfalls to keep in mind
- Limited view. Futures books publish a fixed number of levels. Size beyond them is invisible to any tool.
- Displayed size is not committed size. Resting orders can be cancelled at any moment, and size further from price is pulled more often.
- Feed quality. A depth feed that drops or batches updates distorts every measure here. BookPilot refuses to arm if no depth update arrived in the last 5 seconds.
- Timing. Measures computed from the PC clock differ run to run. The Vantedge engine uses event timestamps, so replays are repeatable.
Using these measures
Watch them in Market Replay before trusting them live. Note how often a strong depth ratio leads to a move on your instrument, and how often it fades. The BookPilot user guide lists the settings behind each scanner, and the glossary defines the terms used here.
Better depth measurement sharpens your view of the book; it does not make futures trading safe. Test any depth-based strategy in Market Replay and SIM before it trades an evaluation, funded or live account.